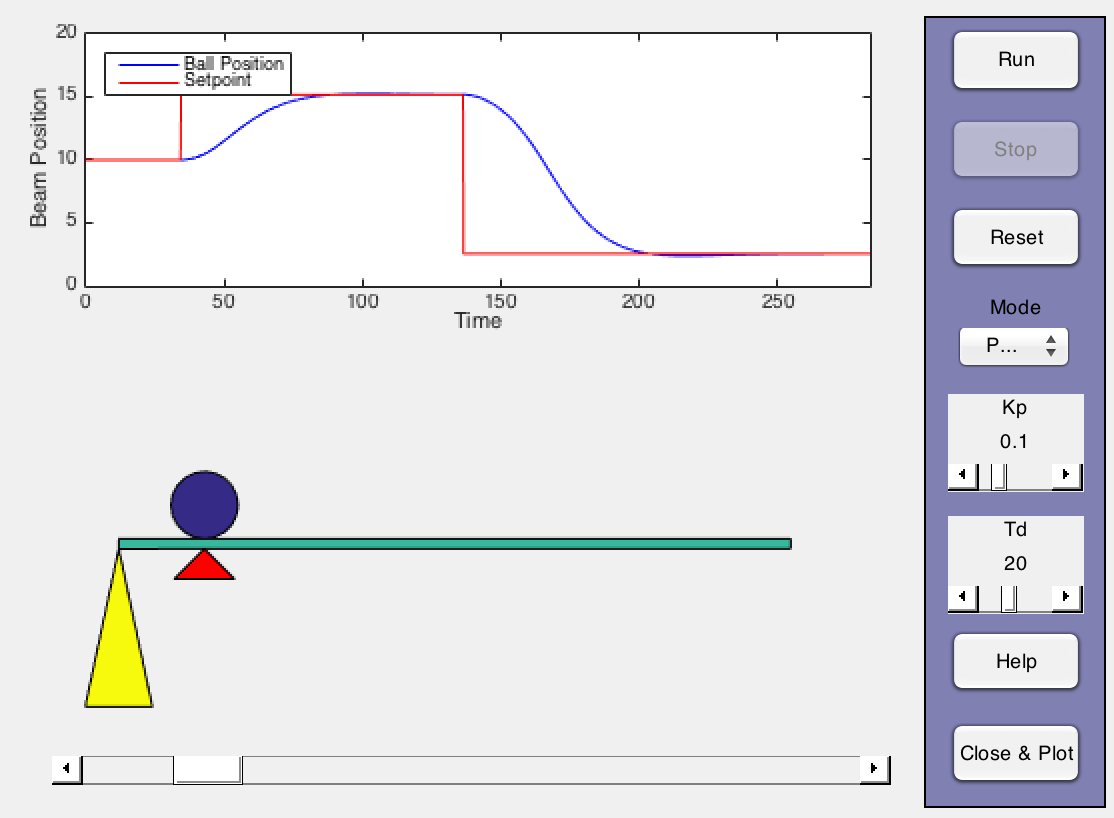
Ball and Beam Control Demonstration
Ball and Beam Control Demonstration is an interactive demonstration of feedback control for a ball and beam system. It was written in Matlab to demonstrate proportional and proportional-derivative control in the classroom and for homework exercises. It was originally written in 2001, and revised in 2011 for the then-current version of Matlab. The github repository was created in 2015.

Installation
The demonstration is self-contained in a single Matlab function. Download it by clicking on this link and saving to your Matlab directory with the name ballbeam.m.
Alternatively, you can download the whole project as a .zip file from github or Matlab Central. Unpack and place the resulting folder in your Matlab directory.
User Interaction
Start the demo by entering ballbeam at the Matlab command prompt with no arguments:
ballbeam
The demo begins in manual mode. The bottom slider adjusts the setpoint indicated by the red marker. The vertical slider moves the end of the beam up and down.
Push the Run button to start the simulation. The ball will roll back and forth on the beam as you move the end of the beam up and down. The simulation is stopped by pushing the Stop button or when the ball rolls off either end of the beam.
Control of the beam can be placed in automatic proportial or proportional-derivative at any time during the simulation. Selecting these modes brings up sliders to adjust the proportional gain and derivative time constant. By altering the control parameters, the user can explore a wide range of behaviors in response to setpoint changes and disturbances.
The simulation window can be restarted by clicking the Stop button followed by Reset.
Upon closing the window, a new figure window appears showing a summary of the simulation. Detailed values of position, beam angle, setpoint, and control parameters are retrieved from ballbeam.mat using the command
load ballbeam
For example, the following Matlab code creates the plots shown at the conclusion of the simulation.
load ballbeam

subplot(2,1,1);
plot(tdata,xdata,tdata,xspdata,'Linewidth',2);
xlabel('Time [sec]');
ylabel('Beam Position [cm]');
title('Controlled Variable and Setpoint');
legend('Ball Position','Setpoint','Location','Northwest');

subplot(2,1,2);
plot(tdata,udata,'Linewidth',2);
xlabel('Time [sec]');
ylabel('Beam Angle [rad]');
title(sprintf('Final Kp = %5.2f, Td = %5.2f', Kp, Td))
Theory
An introduction to the analysis of the closed-loop ball beam system in an accompanying notebook: