5.2. Lab Assignment 4: Relay Control#
In this lab assignment you will implement relay control for the Temperature Control Laboratory.
Implement and test a relay control for the heater/sensor system
Implement and test a relay control to track a complex setpoint.
5.2.1. Exercise 1. Relay (or On-Off) control#
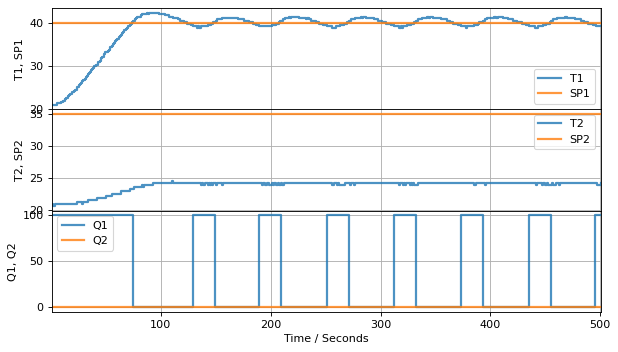
Create a notebook to implements a relay control for the Temperature Control Lab subject the following requirements:
Simultaneous control of sensor temperatures T1 and T2 to setpoints 35 and 40 degrees, respectively. The setpoints return to 25 deg C at t = 300.
Use a tolerance value \(d\) of 0.5 deg C.
Set the minimum and maximum values of the heater to 0 and 100%, respectively. lab.P1 and lab.P2 should be left at their default values.
Show the results of an experiment in which the setpoints are adjusted as
Some started code is include below.
from tclab import TCLab, clock, Historian, Plotter, setup

TCLab = setup(connected=False)

# modify these setpoints to change with time

def SP1(t):
    return 40

def SP2(t):
    return 35

# relay controller
def relay(SP, d=1, Umin=0, Umax=100):
    U = 0
    while True:
        t, T = yield U
        if T < SP(t) - d/2:
            U = Umax
        if T > SP(t) + d/2:
            U = Umin

# create a single control loop
controller1 = relay(SP1)
controller1.send(None)

t_final = 500
t_step = 1
with TCLab() as lab:
    sources = [("T1", lambda: lab.T1), ("T2", lambda: lab.T2),
               ("SP1", lambda: SP1(t)), ("SP2", lambda: SP2(t)),
               ("Q1", lab.Q1), ("Q2", lab.Q2)]
    h = Historian(sources)
    p = Plotter(h, t_final, layout=(("T1", "SP1"), ("T2", "SP2"), ("Q1", "Q2")))
    for t in clock(t_final, t_step):
        T1 = lab.T1
        U1 = controller1.send([t, T1])
        lab.Q1(U1)
        p.update()

TCLab Model disconnected successfully.

5.2.2. Procedures#
Begin by testing the above code on your laptop.
Create a new cell, copy the code to the new cell, and extend the code to control both T1 and T2 to the desired setpoints.
Create another new cell, modify the setpoint functions to include the switch to 25 degrees at t=300 for both temperatures. Test this cell on your real hardware.
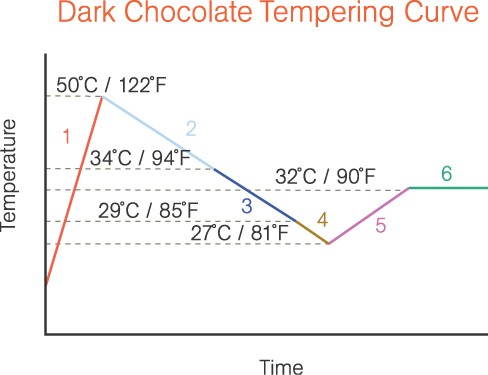
Create one more new cell, and use class notes on setpoints to create a setpoint function using interpolation that reproduces the chart below. Scale time so the whole temperature program can be completed in 10 minutes. The goal is to hit 50 deg C at 3 miinutes, 27 deg C at 7 minutes, return to 32 deg C at 8 minutes, and hold until 10 minutes. The goal is follow the ramp as closely as possible.
Apply the setpoint to T1 while maintaining T2 at a constant 30 deg C.


