Low-Level Measurement
Contents
Low-Level Measurement#
References#
[Art of Electronics, Chapter 8]
Limits to Measurements#
Sources of noise
White noise:
Shot noise from the discrete nature of charge carriers
Johnson noise caused by thermal fluctuations
Other noise:
Flicker 1/f noise from a variety of sources
…. and many more!
Shot Noise#
Description and theory, Walter Schottky, 1918.
Shot noise is the noise due to descrete nature of electric charge. Shot noise can be modeled as a Poisson process. A fundamental consideration in electrical and optical devices including photography.
In a Poisson process:
Poisson processes model the occurrence of independent events that occur one at a time.
The probability of exactly one event in a sufficiently short interval \(h\) is \(P = \nu h\) where the constant \(\nu\) is the average rate of events.
Each interval is a Bernoulli trial. The number of events in a time period is given by
\(\mu = \nu h\) is the expected number of events in the interval \(h\)
\(\sigma^2 = \nu h\) is also the variance in the number of events in interval \(h\).
The waiting time between events follows an exponential distribution. The probability of waiting longer than \(t\) is
or less that \(t\)
This last expression is the cumulative distribution function. The probably density function is the derivative
Frequency domain
A frequency-domain derivation of shot noise
where \(q = 1/C\) is the electron charge \(1.60\times 10^{-19}\) C.
Signal to Noise Ratio
Signal to noise ratio is normally expressed as the power of the signal divided by the power of the noise.
If the interval is \(\delta t\) the current is \(I\), rate of charge carriers is \(C I h\) where \(C\) is Coulomb constant. The SNR is then
Question: Suppose you need 5 sigma accuracy (i.e, \(\frac{\mu}{\sigma} > 5\)) and are measuring a 1 nA signal, what is the fastest sampling rate you can expect?
Simulated Photon Noise
A sequence of images in which the average number of photons captured per pixel increases by factors of 10x between images. source

Question:
Which image has the most noise?
Which image has the lower signal to noise ratio?
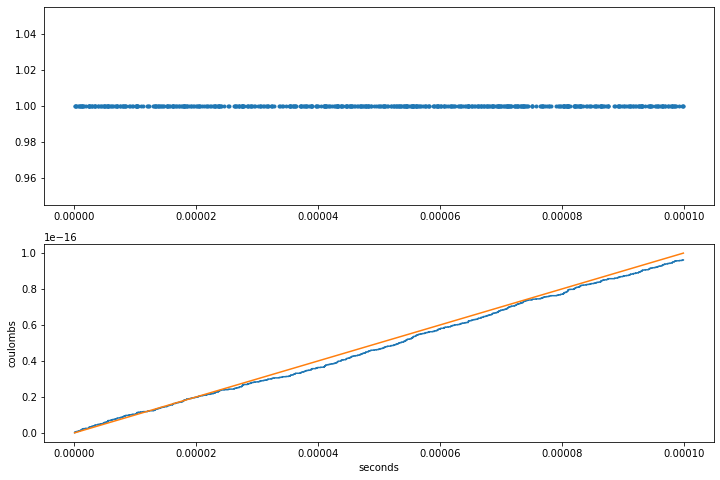
# Demonstration
#
# Simulate shot noise for a 1 pA current

%matplotlib inline

import random
import math
import numpy as np
import matplotlib.pyplot as plt

# constants
C = 6.241509074e18     # number of electrons in a Coulomb
I = 1e-12              # 1 pA of current
h = 1e-6               # 1 microsecond

nu = C*I
print("nu =", nu, "electrons per second")
print("expected number of electrons per step nu*h =", nu*h)

K = 600

# simulate arrival of K charge carriers
dt = np.random.exponential(1/nu, size=(K))
t = np.cumsum(dt)

# plot results
y = np.array([1]*len(t))

fig, ax = plt.subplots(2, 1, figsize=(12, 8))
ax[0].plot(t, y, '.')

ax[1].step(t, np.cumsum(y)/C, where="pre")
ax[1].plot(t, I*t)
ax[1].set_ylabel('coulombs')
ax[1].set_xlabel('seconds')
nu = 6241509.074 electrons per second
expected number of electrons per step nu*h = 6.241509074
Text(0.5, 0, 'seconds')

Johnson-Nyquist Noise#
Discovered and measured by John B. Johnson, Bell Labs, 1926
Explained by Harry Nyquist, Bell Labs, 1928.
Johnson noise has the same origins as black-body radiation. The average (root mean square) voltage due to thermal noise in a resistor is
where \(k\) is Boltzmann’s constant, T is absolute temperature, R is resistance, and B is bandwidth in Hertz. At 20 deg C
\begin{align*} 4kT & = 1.62 \times 10^{-20} & V^2/Hz-\Omega \ \sqrt{4ktR} & = 1.27\times 10^{-10}\sqrt{R} & V/Hz^{1/2} \end{align*}
The short-circuit current noise is
Question: What is the RMS voltage of 10k ohm resistor?
High resistances results in noisy voltage signals
Low resistance results in noisy currrent signals
Chemical Applications#
Electrochemical Measurements
Ion-selective electrodes
pH measurements
Conductivity cells
Potientiostat/Galvanostat

